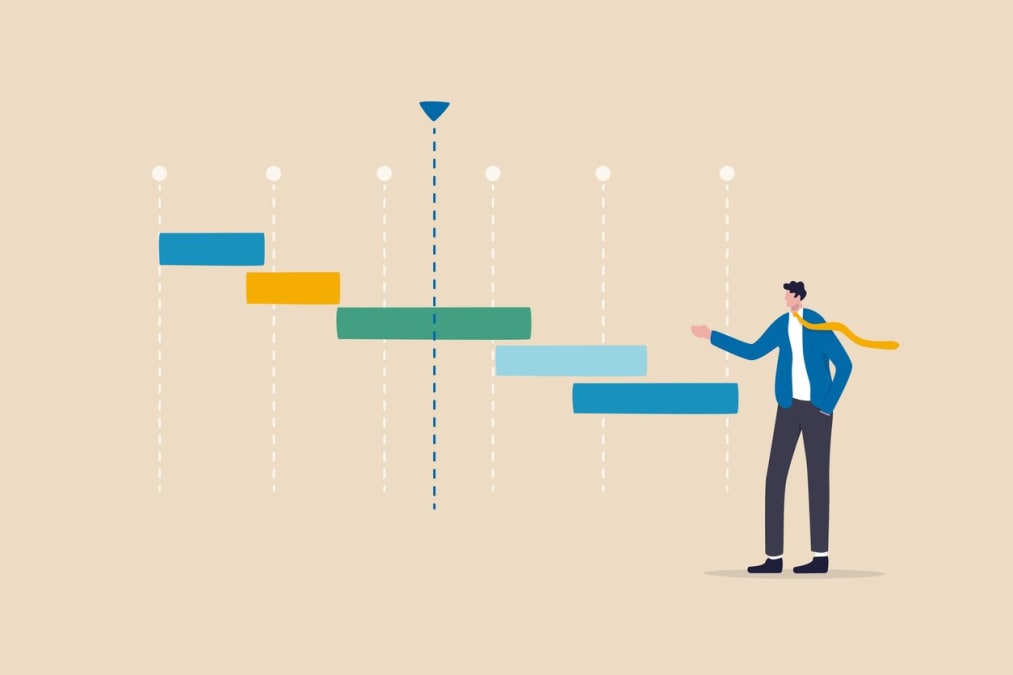
When it comes to project management, a visual guide can make all the difference. That’s where the Gantt chart comes in, offering a clear, concise roadmap to project success.
Key takeaways
- Gantt charts are a visual timeline tool used to help project teams manage tasks and monitor progress.
- Establishing timelines, dependencies, tracking progress with bar elements, and customizing the chart for clarity are key components of Gantt chart use.
- Leveraging Gantt Charts for Agile Project Management can provide a roadmap of the project timeline and prioritize work. When selecting software consider usability, integration capabilities & customization options.
Diving into Gantt charts: a visual project management staple
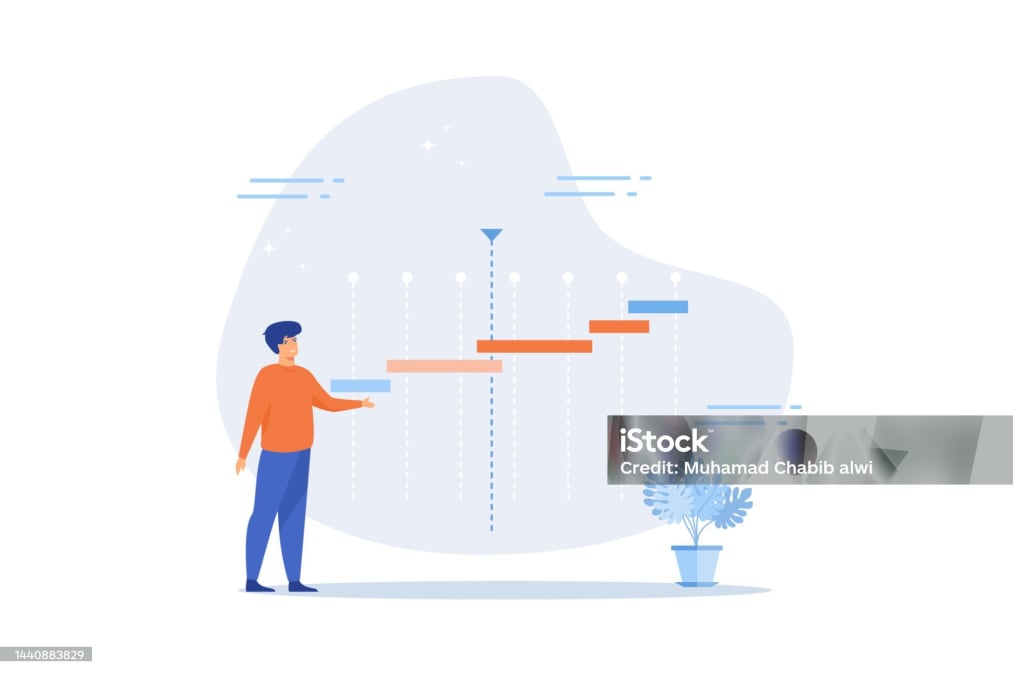
Imagine a tool that lets project managers visualize every task and milestone, track progress, and ensure project completion on schedule. That’s a Gantt chart in a nutshell. Named after Henry Gantt, who popularized this method of visual project management, Gantt charts have become a staple in industries worldwide.
A Gantt chart is essentially a horizontal bar chart that provides a visual timeline for project tasks. Each bar in the chart represents a project task, with the position and length of the bar reflecting the task’s start date, end date, and duration. It’s a simple, yet effective tool that helps project teams visualize how tasks relate to one another and how the whole project is progressing.
The anatomy of a Gantt chart: key components unveiled

While Gantt charts may seem simple, they’re made up of several key components that work together to provide a complete picture of project progress. These include:
- Tasks
- Milestones
- Timelines
- Dependencies
- Progress tracking with bar elements
Tasks and milestones represent the work requirements and significant events, respectively. Timelines illustrate when each task should commence and conclude. Dependencies show the relationship between tasks, indicating which tasks need to be completed before others can begin. Finally, bar elements facilitate progress tracking and necessary adjustments.
Defining project tasks and milestones
In a Gantt chart, tasks are the basic units of work, and each one is represented by a bar. Tasks have specific start and end dates, and their duration is represented by the length of the bar. Milestones, on the other hand, are significant events or achievements in the project, often marked by a special symbol on the timeline.
These components were not chosen arbitrarily. They were the brainchild of Henry Gantt, a supervisor in the steelworks, who pioneered the use of bar charts for visually planning production. Today, his approach is recognized as the Gantt chart method, an indispensable tool for project management.
Establishing timelines and dependencies
Timelines and dependencies are crucial in a Gantt chart as they provide a clear roadmap of the project’s flow. Timelines are represented by the horizontal axis of the chart, indicating when tasks should start and end. Dependencies, on the other hand, show the relationship between tasks, helping project managers understand the sequence of tasks and plan accordingly.
Typically, a Gantt chart illustrates four types of task dependencies:
Understanding these dependencies is crucial when planning an entire project, as it ensures all tasks are completed correctly.
Tracking progress with bar elements
Beyond planning and scheduling, Gantt charts are excellent tools for tracking progress. This is largely thanks to the Gantt chart bars, which represent tasks. As tasks progress, the corresponding bars are filled in, providing a clear visual indicator of how much work has been completed and how much is left to do.
There are several ways to represent progress in Gantt charts. Some of the most common methods include:
- Changing the color of the bar
- Inserting a progress bar within the taskbar
- Varying bar heights
- Including milestone markers
Whichever method you choose, the goal is the same: to provide a clear, visual way to track and communicate progress.
Constructing your first Gantt chart: a step-by-step tutorial
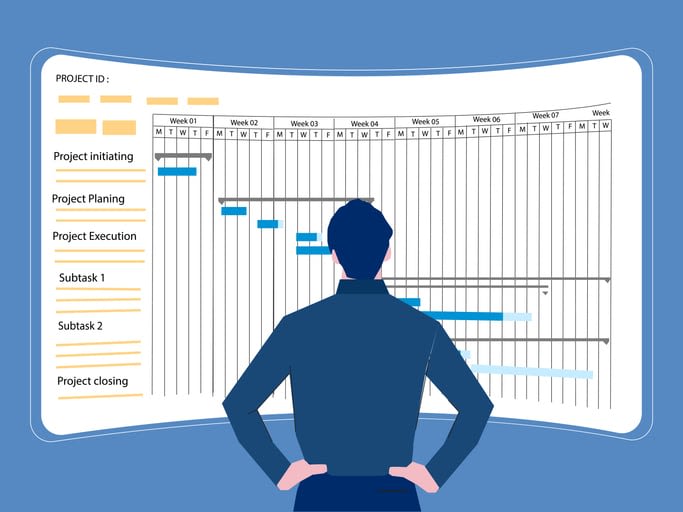
Creating a Gantt chart might appear challenging, particularly for project management beginners. However, it’s simpler than it appears and with the appropriate tools and some practice, you should be able to create a Gantt chart swiftly.
Initiate by gathering the pertinent information for your chart. This includes a list of tasks, their start and end dates, and any dependencies between them. Once you have this information, you can start putting your chart together. Don’t worry if it’s not perfect at first – Gantt charts are meant to be adjusted and updated as the project progresses.
Selecting the right tool for your Gantt chart
The first step to making a Gantt chart is selecting the right tool. While you can certainly draw a Gantt chart by hand, using a software tool can save you time and make your chart much more accurate and easy to update.
There are many Gantt chart tools available, each with its own pros and cons. Some options to consider include:
- Trello: A simple and user-friendly project management tool that is great for beginners or small projects.
- Asana: A more robust tool that offers advanced features and is suitable for larger, more complex projects.
- Microsoft Project: A widely-used tool with extensive features, ideal for managing complex projects with large teams.
- TeamGantt: A user-friendly tool specifically designed for creating Gantt charts, making it a great choice for project management.
When choosing a tool, consider factors like your project’s complexity, your team’s size, and your preferred work style.
Customizing your Gantt chart for clarity
Once you’ve chosen a tool and created your Gantt chart, it’s time to customize it for clarity. A well-designed Gantt chart is clear, easy to read, and provides a visual representation of the project’s timeline.
To customize your Gantt chart, consider using different colors for different tasks or stages of the project. This can make it easier for team members to quickly understand the chart and identify their tasks. You can also add labels to tasks and milestones for additional clarity.
Finally, ensure your chart is updated as the project advances. This will help your project team stay on track and easily see any changes to the project schedule, making project scheduling more effective.
Advantages of implementing Gantt charts in project management
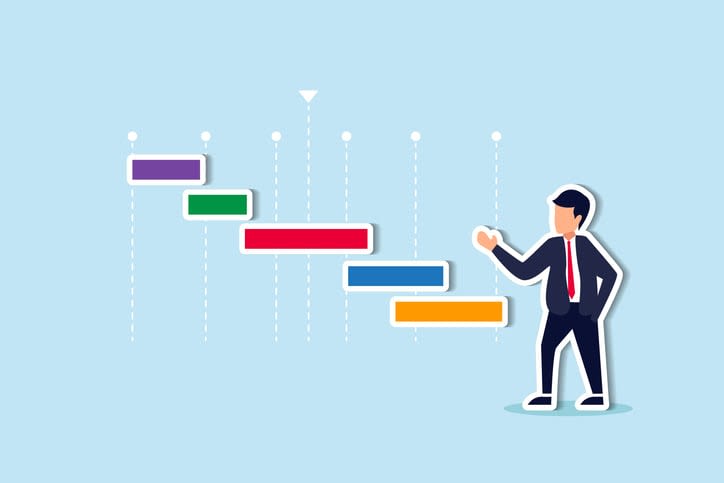
Gantt charts have a lot to offer to project managers. With their clear visual representation of tasks, timelines, and progress, they can significantly improve project planning and management.
One of the biggest advantages of Gantt charts is their ability to enhance project planning. Gantt charts can:
- Clearly define tasks and timelines
- Help project managers identify potential bottlenecks and make necessary adjustments
- Facilitate resource allocation, ensuring that resources are used efficiently and effectively.
Finally, with their progress tracking capabilities, modern Gantt charts provide a real-time overview of the project, allowing managers to quickly identify and address any issues or delays.
Navigating complex projects with advanced Gantt chart techniques

For complex projects, a basic Gantt chart might not be enough. That’s where advanced Gantt chart techniques come in. These techniques can help project managers navigate complex projects with ease, ensuring that all tasks are completed on time and within budget.
One popular advanced technique is task grouping. By grouping related tasks together, project managers can get a clearer view of the project’s structure and progress. Another technique is resource leveling, which helps to balance resource allocation across the project. With resource leveling, a project manager can ensure that no resource is over- or under-utilized, leading to more efficient project execution.
Streamlining collaboration across teams
Collaboration is key in project management, and Gantt charts can be a great tool to facilitate it. By providing a visual representation of the project timeline and tasks, Gantt charts can help team members understand their roles and responsibilities, and see how their work fits into the overall project.
But Gantt charts are more than just a visual tool. They can also be a powerful communication platform. Many Gantt chart tools allow team members to comment on tasks, tag each other, and even share files. This can foster better communication and collaboration among team members, leading to more successful projects.
Balancing resources and deadlines
Managing resources and meeting deadlines can be challenging in project management. Luckily, Gantt charts can help. With their visual representation of tasks and timelines, Gantt charts can help project managers balance resources and keep track of deadlines.
By clearly showing when each task should start and finish, Gantt charts allow project managers to:
- Allocate resources more effectively
- Identify potential bottlenecks or delays
- Adjust plans and resources as needed
- Ensure that projects are completed on time and within budget.
Gantt chart pitfalls and how to avoid them

While Gantt charts can be incredibly useful in project management, they are not without their pitfalls. However, being aware of these potential issues can help you avoid them and get the most out of your Gantt charts.
One common pitfall is over-complication. Gantt charts are meant to be simple and easy to understand, but it can be easy to get carried away and add too much detail. This can make your chart confusing and difficult to read. To avoid this, keep your chart as simple and straightforward as possible.
Another pitfall is a lack of flexibility. Projects often change over time, and your Gantt chart should be able to adapt to these changes. Make sure to update your chart regularly to reflect any changes in tasks or timelines.
Gantt charts in different industries: from construction to tech

Gantt charts are not just for project managers. They can be used in a wide range of industries, including:
- Construction
- Technology
- Marketing
- Event planning
- Research
To get started, you can explore a Gantt chart sample tailored to your industry.
In each of these industries, Gantt charts provide a clear, visual roadmap for project success.
In the construction industry, for example, Gantt charts can be used to:
- Plan and track the progress of a construction project
- Allocate resources
- Coordinate tasks
- Keep track of deadlines
Similarly, in the tech industry, Gantt charts can be used in project management software to manage software development projects, track coding tasks, and coordinate team members.
Leveraging Gantt charts for agile project management

In Agile project management, where projects are broken down into short, iterative cycles, Gantt charts can provide a much-needed visual roadmap. Even though Agile projects are dynamic and subject to change, having a clear overview of the project timeline can help teams stay on track and manage their work more effectively.
Additionally, Gantt charts can be adapted to the Agile methodology by using them to visualize sprint schedules and backlogs. By clearly showing which tasks are planned for each sprint, Gantt charts can help Agile teams prioritize their work and ensure that they are focusing on the most important tasks.
Tools of the trade: comparing popular Gantt chart software
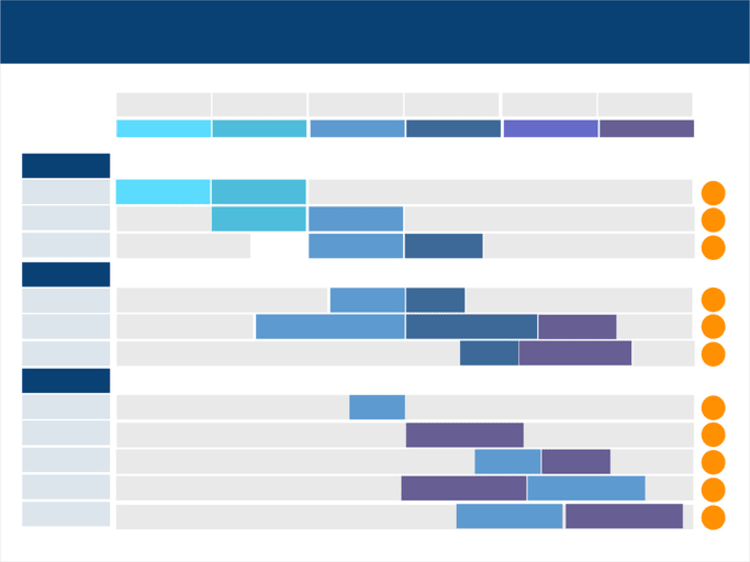
With an array of Gantt chart tools available, selecting the most suitable one can be a challenging endeavor. But don’t worry, we’ve got you covered. Here are some popular Gantt chart tools to consider:
Each tool has its own strengths and weaknesses.
For example, Microsoft Project is great for complex projects, but it might be too complicated for beginners. On the other hand, Smartsheet offers strong reporting capabilities, making it a good choice for teams that need to keep track of project metrics. Ultimately, the best tool for you will depend on your project’s needs and your team’s preferences.
Criteria for choosing the best Gantt chart tool
When choosing a Gantt chart tool, there are several factors to consider. First, consider the tool’s usability. An intuitive user interface and ease of use will make it easier for your team to navigate and use the tool effectively. Also, consider the tool’s integration capabilities. A tool that integrates well with other software your team uses can greatly improve your workflow.
Another important factor is the tool’s collaboration features. Tools that allow for commenting, tagging, and file sharing can enhance communication and collaboration among team members.
Moreover, tools or software that help streamline communication are extremely helpful to complement any of the above-mentioned Gantt chart tools. One such software is Kumospace, acclaimed for its ability to streamline communication, foster human connection, and exponentially increase productivity. Using features in Kumospace such as team chat, screen sharing, and online whiteboards are wonderful reciprocals when creating and using Gantt charts.
Lastly, consider the tool’s customization options. A tool that allows you to easily customize your Gantt chart can help you create a chart that suits your project’s specific needs.
Elevate your planning skills with Kumospace insights

Gantt charts can be a powerful tool in your project management toolkit, but they can also be challenging to master. That’s where Kumospace comes in. With its interactive features and real-time collaboration capabilities, Kumospace can help you take your project planning skills to the next level.
Kumospace offers a suite of features and tools to help you plan, schedule, and track projects using Gantt charts. These features include visual aids, milestones, and the ability to highlight progress along a timeline. Whether you’re a project management novice or a seasoned pro, Kumospace can provide the insights you need to make the most of your Gantt charts.
Summary
In conclusion, Gantt charts are an invaluable tool for project management. With their visual representation of tasks, timelines, and progress, they can improve project planning, enhance team collaboration, and help ensure project success. Whether you’re managing a small project or a complex one, a Gantt chart can help you stay on track and reach your project goals. So why not give it a try? With the right tools, complimentary software, like Kumospace, and a bit of practice, you’ll be creating effective Gantt charts in no time.
Frequently Asked Questions
Gantt charts are a popular project management tool used to visually plan, schedule, and monitor tasks and resources over time. They consist of a list of activities displayed against a timeline, depicting their relationships and progress. Gantt charts help teams track project progress and ensure deadlines are met.
Yes, you can create a Gantt chart in Excel by selecting the data you want to chart, clicking Insert > Insert Bar Chart > Stacked Bar chart, and formatting the stacked bar chart to appear like a Gantt chart. If needed, you can also delete the legend or chart title.
Gantt stands for Henry Gantt, the American mechanical engineer and management consultant who introduced the first chronological chart as a project management system. His name is now widely used to refer to this type of chart, also known as a Gantt chart or Gannt chart, which is a horizontal bar chart showing a project plan on a timeline.
A Gantt chart is made up of four components: tasks, timelines, dependencies, and progress. Each element contributes to understanding the overall structure of a project and helps plan for successful completion.
Gantt charts can become overly complicated and lack flexibility if not properly managed, so to avoid these pitfalls ensure your chart is kept simple and up to date to reflect any changes in tasks or timelines.
